
UX audit of an online store offering popculture and cat-themed accessories.
Akuma Inn
Project
Info
Role
UX Researcher
UX Designer
Timeline
February - April 2022
Tools
Google Analytics
Figma
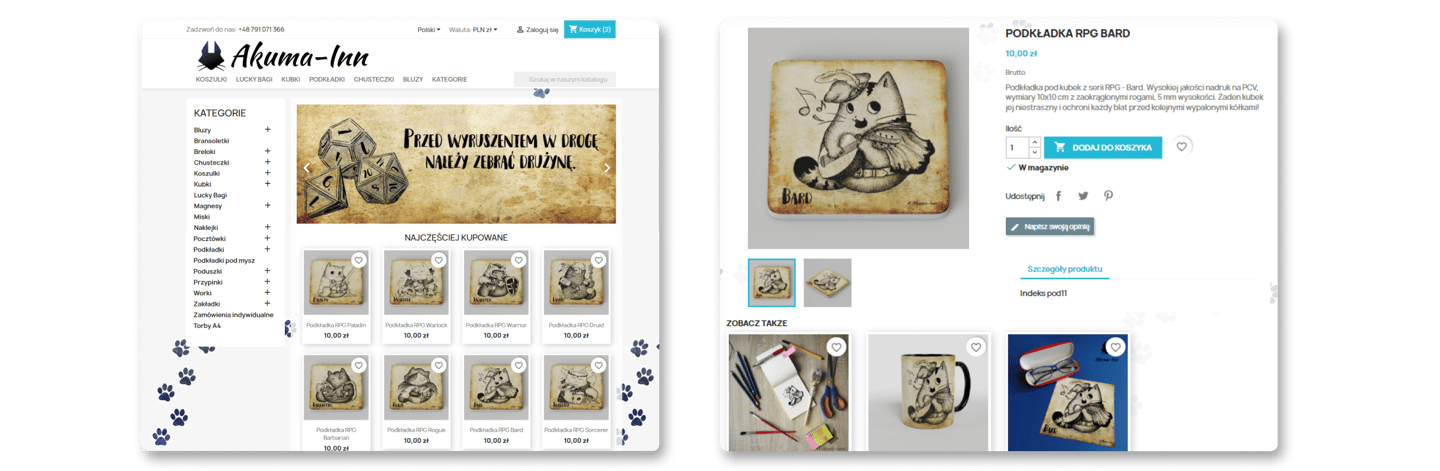
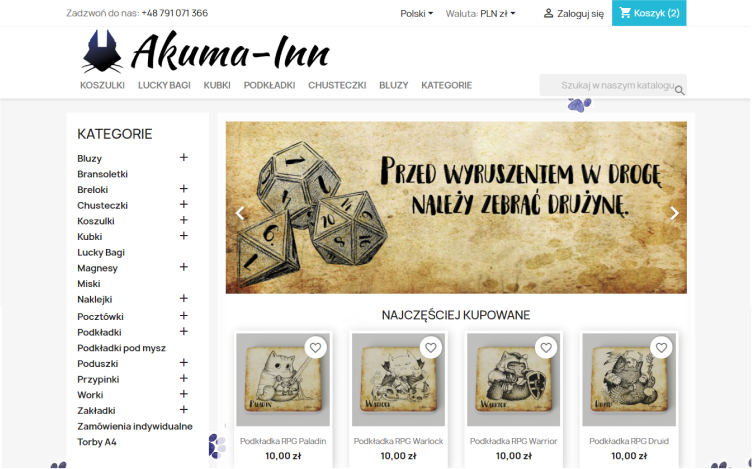
Akuma Inn is an online store offering popculture gadgets, like t-shirts, mugs and bags with fantasy, anime and sci-fi themes. Before 2023 client made about 30% of yearly income in in-person sales during various events. However due to health problems they aimed to switch to online sales exclusively and so it was crucial for them to improve the website's business potential. I was asked to help with page redesign and improving sales metrics from UX perspective.
Overview
Conversion rate (understood as purchase) was not satisfying for the business owners as it did not generate the desired revenue. Clients mostly bought one item per order and often left in the middle of the purchase process.
My research and subsequent redesign contributed to improving navigation path, sales increase and reducing bounce rate.The store owners feel secure about their business and can focus on expanding their offer.
Problem
Outcome
End result
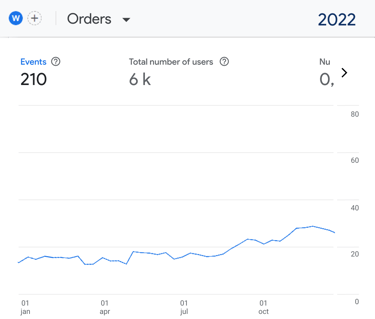
Major web metrics

Design process
Tracing the problem
1
analyzing web metrics and identifying key exit points
2
Understanding user behavior
behavioral tests with 8 users, evaluation of site's usability and accessibility
3
Ideation
mapping new user flows and wireframes, design iterations
4
Implementation
redesigning parts of the website and going live
Checking Google Analytics
Improving conversion rates starts with understanding where customers bounce. We analyzed exit pages to see where in the cart customers are giving up. Many clients were leaving at the checkout stage, not proceeding to purchase. I decided to conduct usability tests to analyze customer behavior and uncover specific pain points.
Finding Quantitative Data & metrics
Conversion rate (understood as finalized purchase) was not satisfying for the business owners as it did not generate the desired revenue. Average conversion rate was 1.3%. The goal was to increase conversion rate, which directly impacts financial revenue. To further understand a customer’s profile I asked the store owners to share sales reports and we discussed which products/categories generate most income and what does atypical order contain.
Exit pages
Conversions
Path exploration
Over 20% of orders were single item transactions and Akuma Inn owners aimed to encourage customers to add more items to the cart (lower packaging and shipping costs, higher average order value).
Average order value
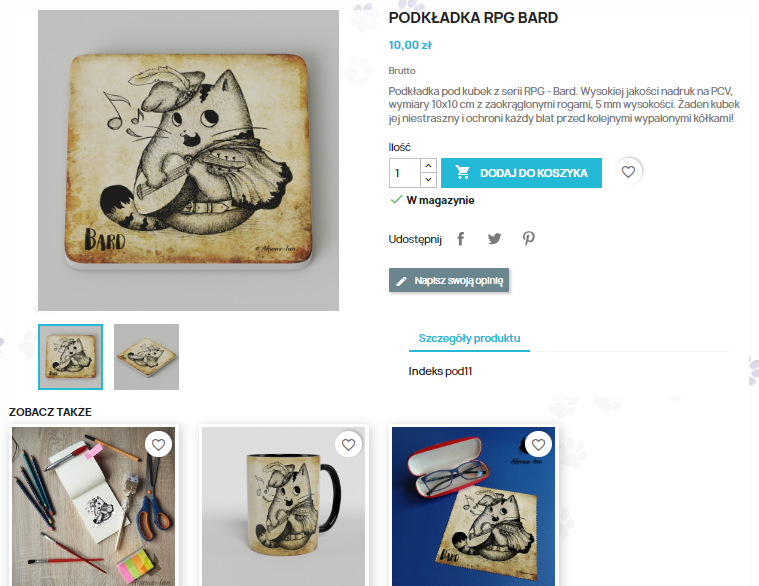
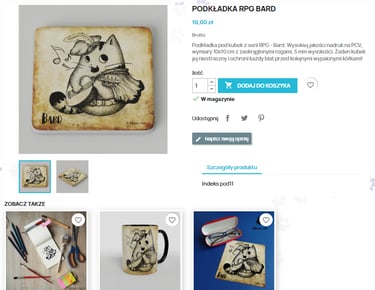
People were looking at similar themes/brands in different categories (e.g. Japan themes in T-shirts and then Bags). Over 70% of customers viewed several other products after adding an item to cart.
Exit pages
Major web metrics
Where do users drop?
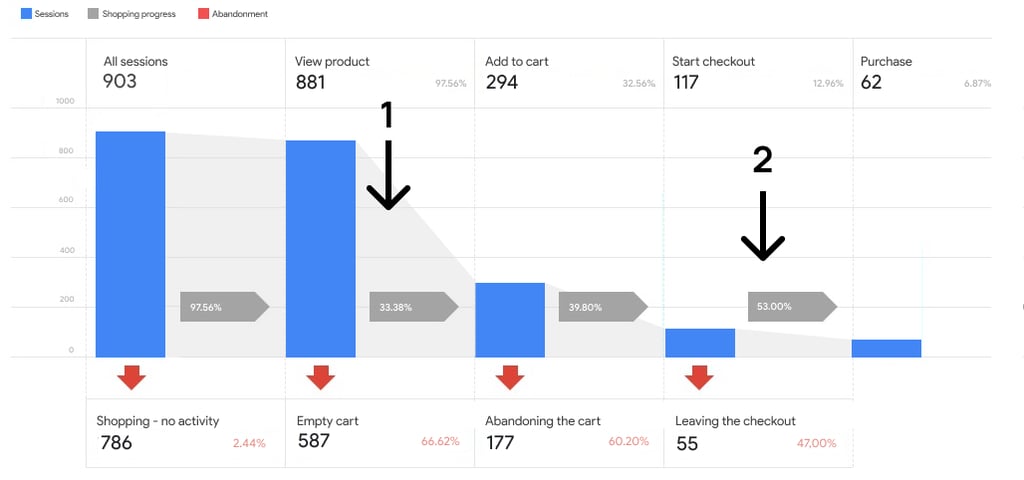
Main stages where users left the store were after viewing a few products (1) and during checkout (2).
Path exploration
Major web metrics
Where do users wander before making a purchase?

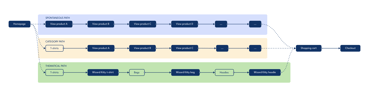
Reverse path exploration helped us determine 3 main pathways of content viewing leading up to checkout. For example, we noticed some customers were looking at items with similar themes, but located within different categories. This could be used to build thematic lists or suggestions.
Qualitative research
Usability tests
I conducted moderated task-based tests with 8 people (all new visitors), observing how they navigate through the website and listening to their feedback.
I wanted to know:
Is the website interface intuitive?
Why do users leave at checkout stage?
What stops them from making a purchase?
Locked currency
New visitors were surprised that prices were displayed in Euro when the site was in Polish. They tried to change the currency by clicking shopping cart button, but the option was not there. They could only change the currency at the checkout.
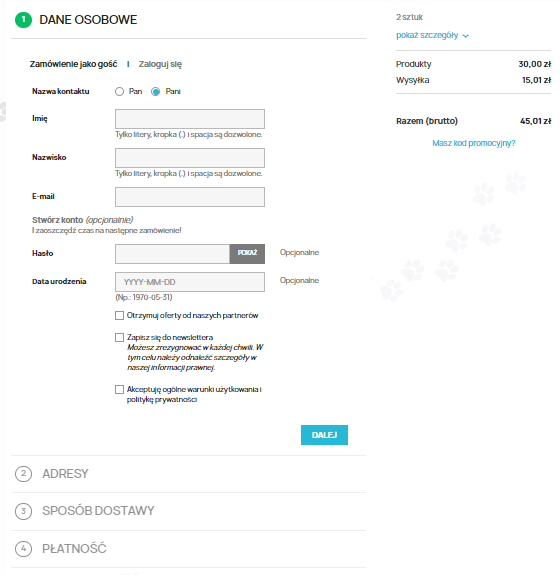
Chaotic checkout
The checkout steps were all cramped up on one page, with 4 different forms stacked next to each other, creating a visual chaos and informational overload. Also the currency issue made it difficult for users to predict the final price.
Final design
Major web metrics
Improvements
Implemented changes:
✓ suggested items displayed on product page
✓ products listed thematically
✓ checkout process divided into steps
✓ currency setting added

Results
01
Project outcomes
Setting up pathway exploration as early as possible helps reveal customer behavior patterns over time. Combining this method with usability testing allows a researcher discover important pain points in the user journey. When analyzing e-commerce, there are many factors that play a role in conversion and user engagement. It's not easy to distinguish which of them are UX-related and which are driven by product inventory. Reviewing various pathways and sales reports may provide some answers.
02
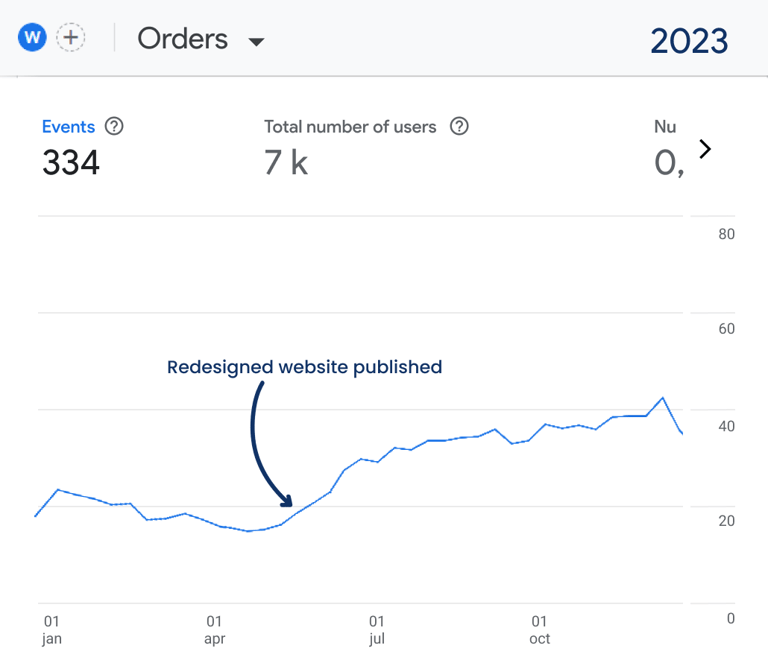
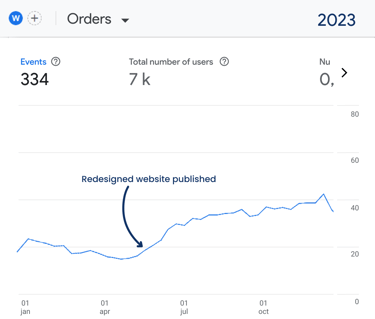
I worked closely with the web developer to ensure the design is implemented correctly. Website metrics analyzed 6 months after new design publication clearly showed improvements and revenue has increased.
Results (compared against the same period of the previous year):
+36% conversion rate
+14% average order value
-29% bounce rate (non-engaged sessions)